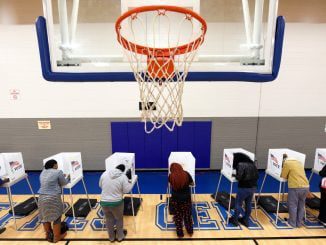
 The last decade has seen a boom in voter turnout — for both parties. Between the 2012 and 2020 presidential elections, total voter turnout rose 23%, with Democratic turnout up 23% and Republican turnout up 22%.
Yet, because of the changing distribution of votes, the results were significantly different. The 2012 election was not a close thing: Mitt Romney could not have reversed the Electoral College result without erasing Barack Obama’s margins of 481,806 votes in four states (Florida Iowa, Ohio, Virginia). By comparison, Donald Trump won in 2016 thanks to a margin of only 77,736 votes in three states (Michigan, Pennsylvania, Wisconsin), and Joe Biden owes his 2020 victory to an even smaller margin of 42,918 votes in three states (Arizona, Georgia, Wisconsin).
One party’s gains with one voting bloc were largely offset by the other party’s gains with another, leaving Democrats with a big popular vote margin but both parties facing a nail-biter to block the other from getting enough electoral votes.
One way to gauge those changes is by looking at the presidential results in each of the 435 congressional districts, helpfully and meticulously calculated by the leftist Daily Kos website. The 2012, 2016 and 2020 numbers are all based on the 435 districts’ boundaries for 2020, taking account of court decisions that have significantly helped Democrats in three states (Florida, North Carolina and Pennsylvania) since 2012.
These districts were closely divided in 2012, 218 for Romney and 217 for Obama. Political redistricting helped Republicans, and the natural disadvantage in equal-population districts for a party whose votes are clustered in relatively few areas hurt Democrats. In 2016, Trump did better, carrying 226 districts to Hillary Clinton’s 209.
Where were the biggest party shifts between 2012 and 2020? Trump ran 10% or more behind Romney in 95 districts in 2020, and 10% or more ahead in 73. Curiously, the results in many of the 267 other districts look pretty much the same in both elections. The revolution in party preference was real but often overstated.
But in 2020, with Trump’s percentages declining among white voters in marginal districts and increasing among Hispanics and blacks mostly in solidly Democratic districts, Joe Biden carried 224 districts and Trump 211. Not coincidentally in this straight-ticket-voting age, Democratic candidates won 222 House seats and Republicans 213.
Trump ran 10% or more behind Romney in 95 districts in 2020, and 10% or more ahead in 73. Curiously, the results in many of the 267 other districts look pretty much the same in both elections.
The drop in Republican percentage was greatest in UT3, Utah’s 3rd Congressional District, centered on Brigham Young University, and the biggest Republican gain was in Ohio’s 6th District, OH6, along the Ohio River across from West Virginia. As I first noted in March 2016, support for Donald Trump is inversely proportional to degree of social-connectedness. The heavily Mormon UT3 is perhaps America’s most socially connected congressional district, and the oxycontin-afflicted OH6 may be America’s least.
The second-biggest increase in Republican percentage came in OH13, which includes long-ailing factory towns Youngstown and Akron. The second-biggest Republican drop was in GA6 in the affluent Atlanta suburbs, which ranks sixth among 435 districts in percentage of college graduates.
OH13, once represented by Democratic blue-collar folk hero Jim Traficant, twice voted 51% for Donald Trump, after voting 63% to 35% against Romney. It’s emblematic of many blue-collar districts that trended Trumpward over the past eight years.
GA6, once represented by Republican House Speaker Newt Gingrich, voted 61% to 37% for Romney over Obama. But it almost went Democratic in a 2017 special election, flipped easily in 2018 and then voted 55% to 44% for Biden over Trump. It’s typical of many affluent, high-education districts in metro Atlanta, Dallas, Houston, Austin and Phoenix, and in northern Virginia and Orange County, which trended Democratic in the 2010s, much as their northeastern, upper Midwest and West Coast counterparts did in the 1990s.
These switches in presidential preference have reverberated in congressional elections. Eleven of the 20 districts where Republicans suffered the greatest percentage losses now have Democratic House members, even though all but one easily elected Republicans for years. Similarly, 11 of the 20 districts where Republicans have made the greatest percentage gains now have Republican congressmen, although only five have a solidly Republican heritage.
The partisan strife of the last decade has failed to produce either the long-predicted, natural Democratic majority or the sometimes-projected MAGA nation. But it has shown both parties capable of adapting to unforeseen challenges. And it has produced the most robust voter turnout in more than a century.
Michael Barone is a senior political analyst for the Washington Examiner, resident fellow at the American Enterprise Institute and longtime co-author of The Almanac of American Politics.


