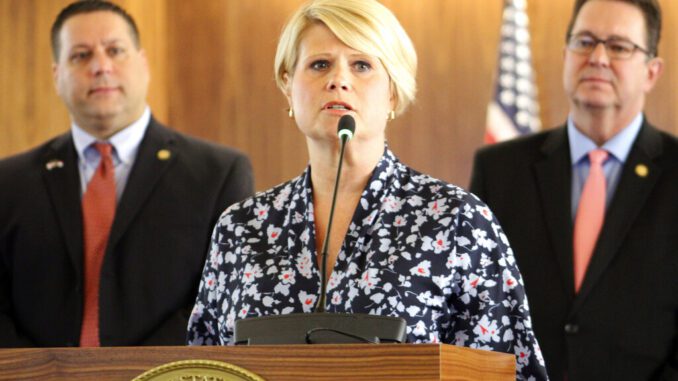
RALEIGH — At the Aug. 3 meeting of the State Board of Education, N.C. State Superintendent Catherine Truitt reported “incredible gains” in literacy scores by the state’s K-3 students.
During the board meeting, Truitt said North Carolina’s K-3 students continue to see improvement across all subjects and subgroups with a “few caveats to mention.”
Truitt credited the phonics-based “the science of reading” and teacher training in Language Essentials for Teachers of Reading and Spelling (LETRS).
“First of all, looking back over the last year and since our teachers have begun their incredible work on LETRS training, volume one and two, we can say with certainty that the post-pandemic rebound began last year for our kindergarten through third-graders,” Truitt told the board.
North Carolina’s 437,498 K-3 students were assessed using Amplify’s early literacy screener called DIBELS 8, which stands for “Dynamic Indicators of Basic Early Literacy Skills.” Just under 12,000 students were assessed using Amplify’s Spanish language literacy screener.
“Our kindergarteners from the beginning of this year to the end of this year saw a 46% increase statewide in their percentage of students who are on track or [are] ready for core instruction,” said Truitt during her presentation.
According to the presentation slides shared with the board, between beginning-of-year (BOY) tests and end-of-year (EOY) literacy testing, first-graders saw a 22% increase, second-graders saw a 13% increase and third-graders saw a 6% increase.
Truitt also pointed out that K-3 students in North Carolina outperformed the nation.
“What we need to remember when we look at this data is our third-graders were the group that missed all of kindergarten and half of first grade and that our second-graders missed half of a year as well,” Truitt said. “Also, those students did not have teachers who had begun the LETRS professional development.”
Truitt said Amplify’s data shows “very little movement” for the nation’s third-grade students.
In her presentation, Truitt shared data on the percentage of North Carolina students considered “at-risk” compared to the rest of the nation. From BOY to EOY, kindergarteners needing intervention dropped from 53% at the start of the year to 15% at the end of the year. Nationally, the drop went from 45% to 22% for the same time frame results.
Subgroups (white, Asian, black, Hispanic, Native American/Native Alaskan) also outperformed when compared to national results.
“We outperformed the nation except for Hispanic students where there was a 1% difference,” said Truitt. “However, what we see here is that white students had a 23 percentage point gain from the beginning of the year, Asian students had an 11 percentage point gain from the beginning of the year, black students had an 18 percentage point gain, Hispanic students a 22 percentage point gain, and our Native American students also enjoyed a 22 percentage point gain.”
Nationally, the same groups saw smaller gains; white students gained 17%, Asians 7%, blacks 13%, Hispanic 17% and Native American/Native Alaskans 14%.
“These are incredible gains for our subgroups,” said Truitt. “We are also seeing incredible drops in the number of students needing intensive intervention.”
Intensive interventions for North Carolina K-3 white students dropped 16%, Asians 7%, blacks 15%, Hispanics 20% and Native Americans/Native Alaskans 20%. Nationally, the drop for white students was 11%, Asians 4%, blacks 11%, Hispanics 15% and Native Americans/Native Alaskans 12%.
Data on student benchmark composite scores from BOY to EOY for the current year also showed improvement, with 91,451 more students at and above benchmark and 66,750 fewer students below benchmark this year.
“This is an incredible, incredible shift,” Truitt said of the change in benchmark scores.
When discussing the slide on growth statewide among subgroups, Truitt said this was where “we want to be very transparent about where the gaps still are.”
“Even though our students of color saw incredible gains, our white students started way behind also and they saw incredible gains, which means when we look at this data we are seeing the gap for our white and African American students,” said Truitt. “Even though they made such incredible gains, there is still a gap there that increased by 6 percentage points.”
She also noted the white and Hispanic gap was the same and the white and American Indian gap increased by three. Truitt said districts who are “killing it” in addressing gaps are conducting regular progress monitoring of students using DIBELS 8 and other tools.
While this year’s data is still being validated, Truitt believes it will be positive and told the board, “Last year’s EOG data showed we were very close to reaching pre-pandemic levels.”


