RALEIGH — Test score data from the past school year released by the N.C. Department of Public Instruction (DPI) shows overall subject matter improvement, but scores are still below what they were pre-pandemic.
“The recovery is in progress, but it is going to take time,” Tammy Howard, director of DPI’s Office of Accountability, said at an N.C. State Board of Education meeting held Sept. 1.
A DPI press release noted that due to the pandemic, this year’s accountability report is the first time since 2018-19 that all components of the state’s accountability framework.
DPI has cautioned that the current report data needs to be considered within the context of disruptions caused by the pandemic and that even though 2018-19 data is included in the report, it is “not intended to be used as a comparison for the purpose of evaluating effort or drawing conclusions.”
When reviewing the results of the report, it should be noted that testing was waived in spring 2020 due to school closures.
“Last year’s accountability results are really a testament to the resilience, dedication and commitment of thousands of educators across the state,” State Superintendent Catherine Truitt said in the release. “They know as I do that we still have a steep hill to climb and that every step matters.”
The data provided by DPI is the percentage of students who scored at Level 3 and above (grade level proficiency or GLP), at Level 4 and above (college and career readiness or CCR), and at each academic achievement level.
Proficiency rates overall rose from 45 percent in 2020-21 to 51 percent in 2021-22. That’s still short of the 2018-19 pre-pandemic level of 59 percent.
However, according to the report, “None of the content areas and grade levels show a return to the 2018– 19 achievement outcomes except for NC Math 3,” and that from 2018–19 to 2021–22, “NC Math 3 increased 6.6 percentage points (grade level proficiency) and 5.9 percentage points (career and college readiness).”
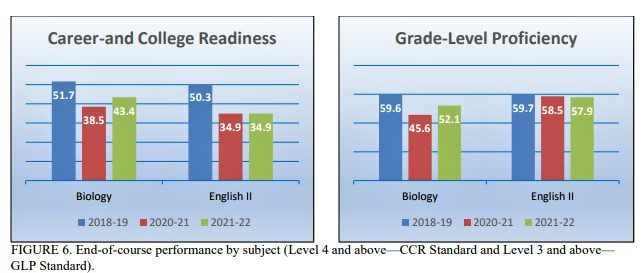
The end-of-course tests (EOC) data for high schoolers show small increases in CCR and GLP across all other math courses with the largest gains being in Grade 8 NC Math 1.
In high school Biology, CCR and GLP percentages rose, but for English II, CCR rates were flat and GLP rates fell by .6 percent.
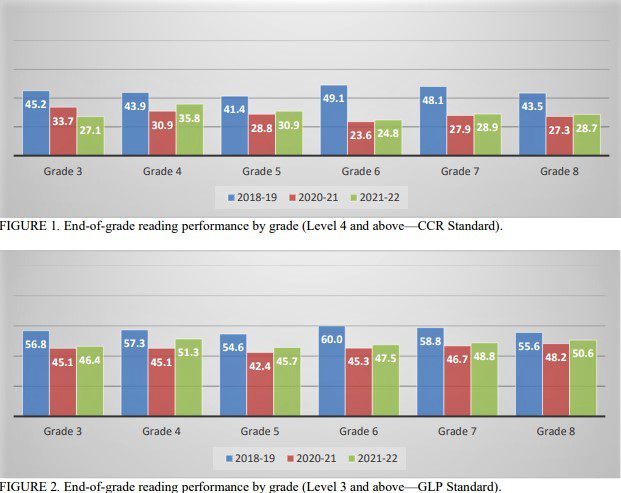
Looking at the end-of-grade (EOG), overall scores in reading and math for grades three through eight increased over the 2020-21 pandemic school year.
In reading, all grades made small gains in reading for CRR and GLP except for third grade, which dropped from 33.7 percent to 27.1 percent in 2021-22. The rate for third grade in 2018-19 was 45.2 percent.
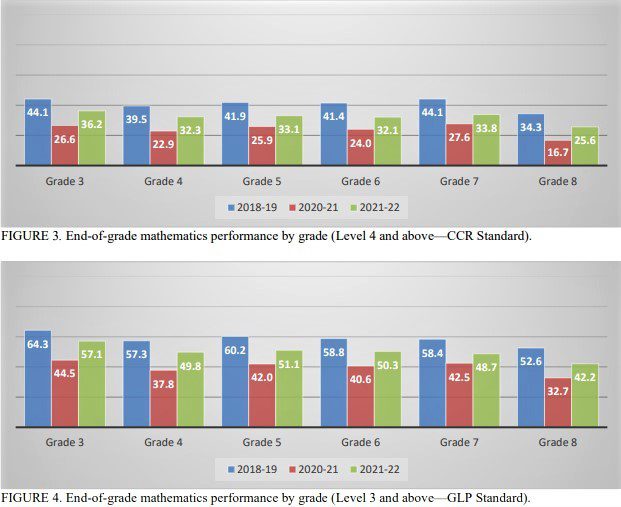
In math, the scores appear to show stronger gains across the board in grades three through eight.
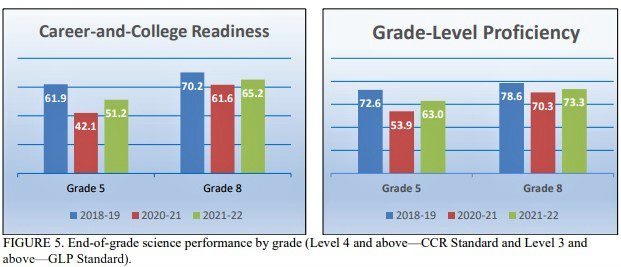
Science in grades five and eight both saw gains with eighth-grade science GLP percentages coming the closest to approaching pre-pandemic levels.
Beyond test scores, the state’s four-year high school graduation rate had a small drop, going from 86.9 percent in 2020-21 to 86.2 percent in 2021-22. The rate in 2018-19 was 86.5 percent.
Earlier this year, DPI’s Office of Learning Recovery had reported K-12 academic student achievement across the state fell behind by between two and 15 months across various subjects during remote learning imposed on students due to pandemic school closures.
Schools in North Carolina are given an A-F letter grade based on how many test pass rates and exceeding growth expectations on those exams. Those ratings were included in the current report for the first time since before the pandemic.
The A-F scale breakdown is as follows: A = 85–100 B = 70–84 C = 55–69 D = 40–54 F = 39 or less
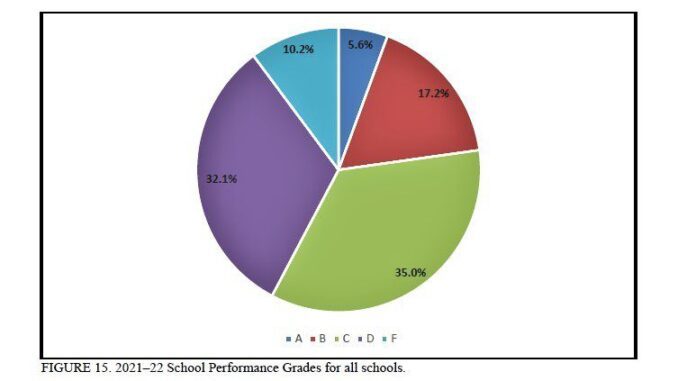
In 2018-19, 488 schools were deemed as low-performing. In 2021-22, that number increased to 864 or a 77 percent increase. Additionally, 23 percent of schools received A and B grades and 42 percent of the schools received D and F grades.
The number of low-performing districts also rose from eight to 29; an almost 263 percent increase.
The number of low-performing public charter schools actually decreased, going from 38 in 2018-19 to 35 in 2021-22.
The A-F grading matrix has been criticized in the past for relying too much on test scores and less on growth.
ACT scores appear to be fairly stable with some impact from the UNC Board of Governors raising the admissions benchmark score from 17 to 19. That change has lowered the percentages of students achieving the new benchmark.
The DPI accountability report shows the percentage of 11th graders achieving the new UNC minimum of 19 was 41.7. In 2020-21 it was 55.2 percent.
“Had the benchmark score remained unchanged at 17, 54.6% of students would have earned the required score,” according to DPI’s press release.
The North Carolina results are encouraging when compared to a new report by the National Center for Education Statistics (NCES) of a special assessment of nine-year-olds in reading and math to see what damage the pandemic had caused in those subjects.
The results showed the “largest average score decline in reading since 1990” and “the first ever score decline in mathematics.” Average scores collected in 2020 in reading dropped five points and seven points in math.


